2D Plot
New This Feature Was Added In HELIO 26.1.1
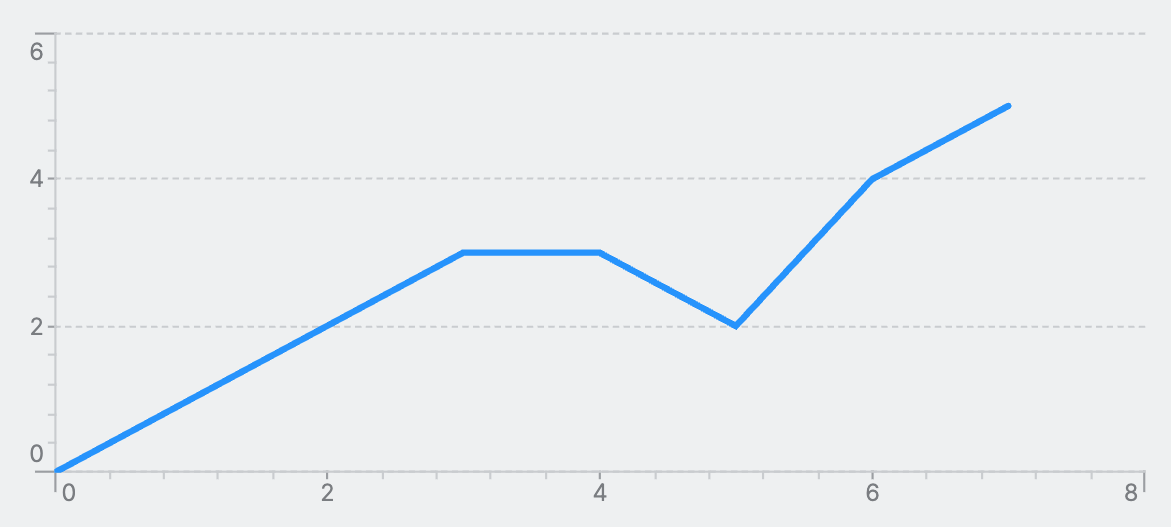
A 2D Plot visualizes the relationship between two datasets by plotting one
array against another on a two-dimensional chart. Each axis can be connected
to a dynamic array from the PLC or configured with a static sequence. A
typical use case is plotting a sensor profile — for example, the light
intensity measured by a photoelectric sensor against the angular position of
a rotating object during inspection.
Both the X and Y datasets must contain the same number of entries. Mismatched array lengths may cause incorrect or missing data in the plot.
Data Sources
Each axis accepts one of the following as its data source:
- Data Variable (Dynamic Property) — a dynamic
Arrayvariable from the PLC, updated in real time - Array (Dynamic Property) — a static list of values defined manually
- Sequence — a static, evenly spaced range of values defined by min, max, and step
Properties
Y-Axis
Name
Choose a name for the 2D Plot line.
Color
Choose a color for the 2D Plot line.
Data
Defines the Y values of each data point.
Requirements When Using a Data Variable (Dynamic Property)
- Must use the
Arrayaccess mode to provide the full array, not a single item. -
Minimum and Maximum Values
The range of the Y-axis is determined by both the minimum and maximum of the linked variable. If these are not set, the 2D Plot will default to a Y-Axis range of 0-100.
Ticks
Control the number of ticks that the Y-Axis will display.
Auto
HELIO will calculate a fitting number of ticks for you.
Density
Select the number of ticks yourself by setting a density. Choose between low, medium and high.
Interval
Precisely select the number of ticks yourself by setting intervals. Choose how often a tick should appear and how often a label should appear.
Segments
Precisely select the number of ticks yourself by setting segments. Choose how many ticks should appear and how often a label should appear.
X-Axis
Data
Defines the X position of each data point.
Requirements When Using a Data Variable (Dynamic Property)
- Must use the
Arrayaccess mode to provide the full array, not a single item. -
Minimum and Maximum Values
The range of the X-axis is determined by both the minimum and maximum of the linked variable. If these are not set, the 2D Plot will default to a X-Axis range of 0-100.
Ticks
Control the number of ticks that the X-Axis will display.
Auto
HELIO will calculate a fitting number of ticks for you.
Density
Select the number of ticks yourself by setting a density. Choose between low, medium and high.
Interval
Precisely select the number of ticks yourself by setting intervals. Choose how often a tick should appear and how often a label should appear.
Segments
Precisely select the number of ticks yourself by setting segments. Choose how many ticks should appear and how often a label should appear.
Container
This icon will be displayed next to the element's label on pages that support it, like the Dashboard Page. An Element can make use of the icon to:
- Provide more context to add meaning
- Improve recognition and discoverability, especially on larger pages
Display Condition
true or false you're good to go.