Visualize and Control Production Workflows Using Flow Maps
Managing production workflows requires clear visibility into every stage of your process. While a Linear Flow works great for displaying linear processes, most manufacturing lines have multiple inputs, quality checkpoints, and branching paths that need a more flexible layout.
That's where the Flow Map Page comes in very handy. It lets you create interactive process diagrams to map your production workflow or visualize processes. With Flow Maps, you can:
Visualize & Control 2D Flows
- Visualize multi-dimensional workflows with multiple inlets and outlets.
- Monitor real-time production status across your entire line.
- Track product flow through multiple manufacturing stages.
- Implement visual quality control with reject handling.
Simplify Complex Flows
- Abstract complex mechanical wiring into clear, understandable process flows.
- Use overlays to create simplified, interactive controls that nontechnical operators can use to manage production.
What Are We Building?
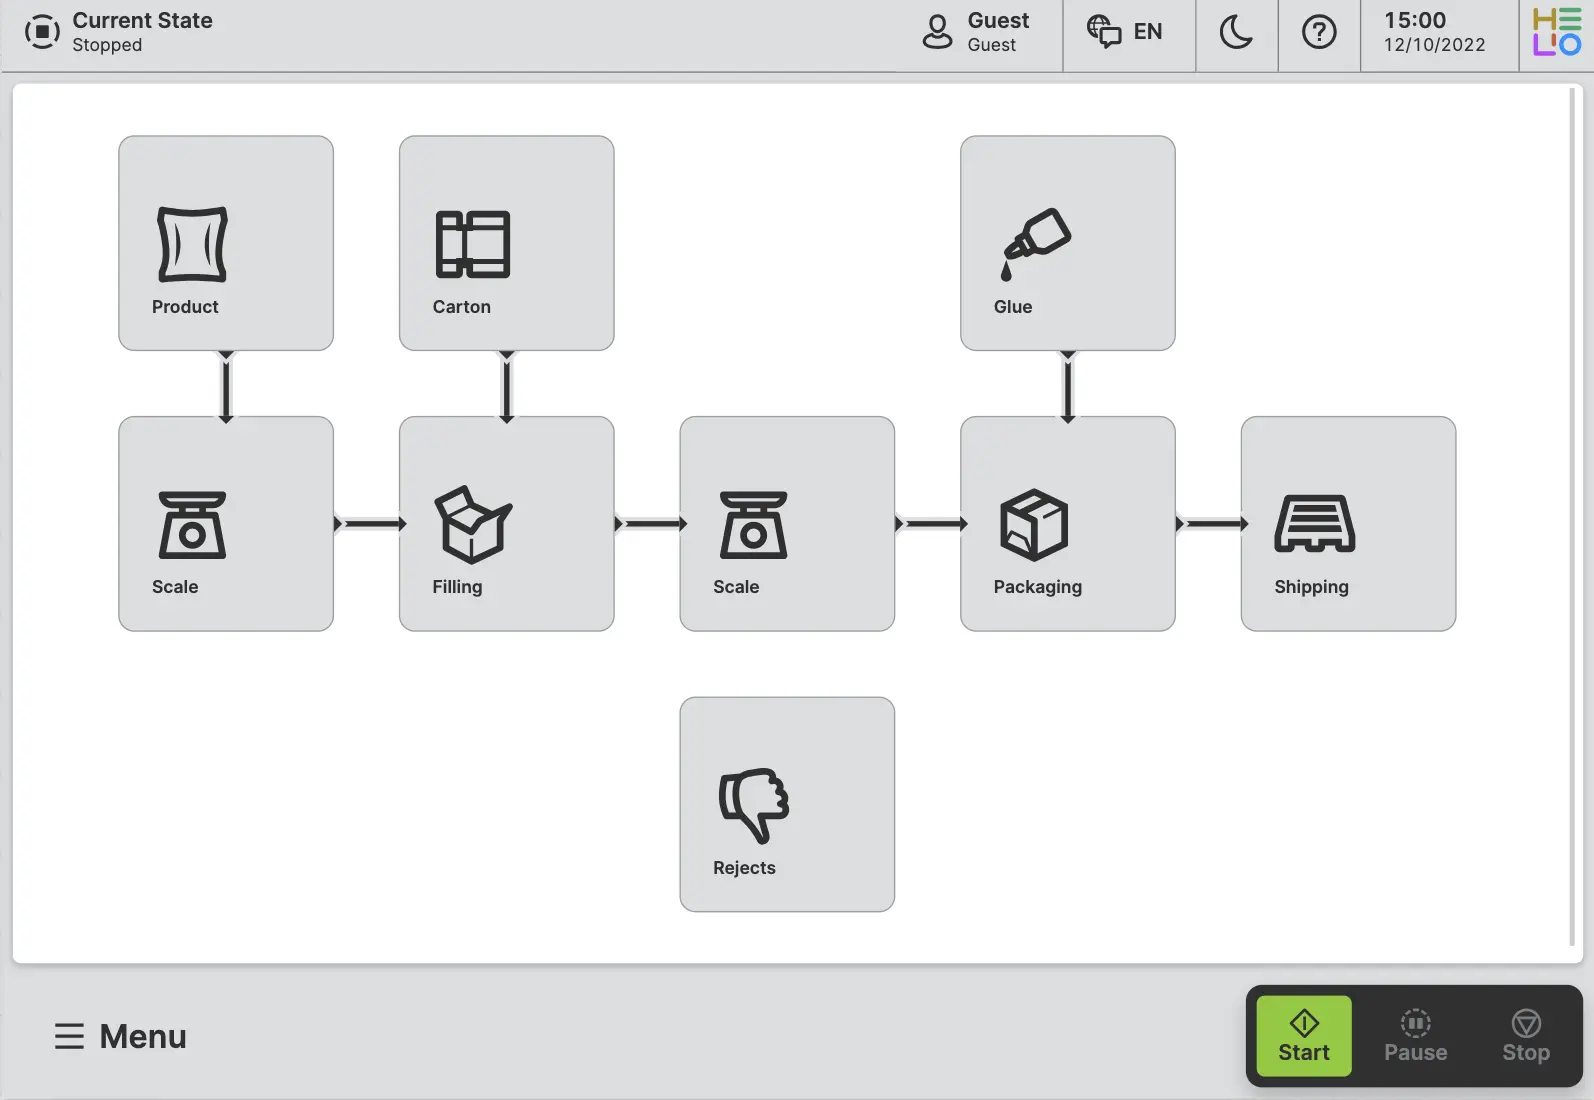
Take a look at the example on the right, that's what we'll create in this guide.
- We'll set up a packaging line workflow where products go through weighing, packaging, and shipping stages.
- The process includes quality control checkpoints that can route defective items to a reject outlet, plus material inlets for cartons and glue needed for packaging operations.
- The quality of both the product and its final package will be checked along the way.
- Any items that are faulty will be sent to a reject branch.
1. Create the Flow Map Page
First, let's set the stage for our workflow.
- Add a
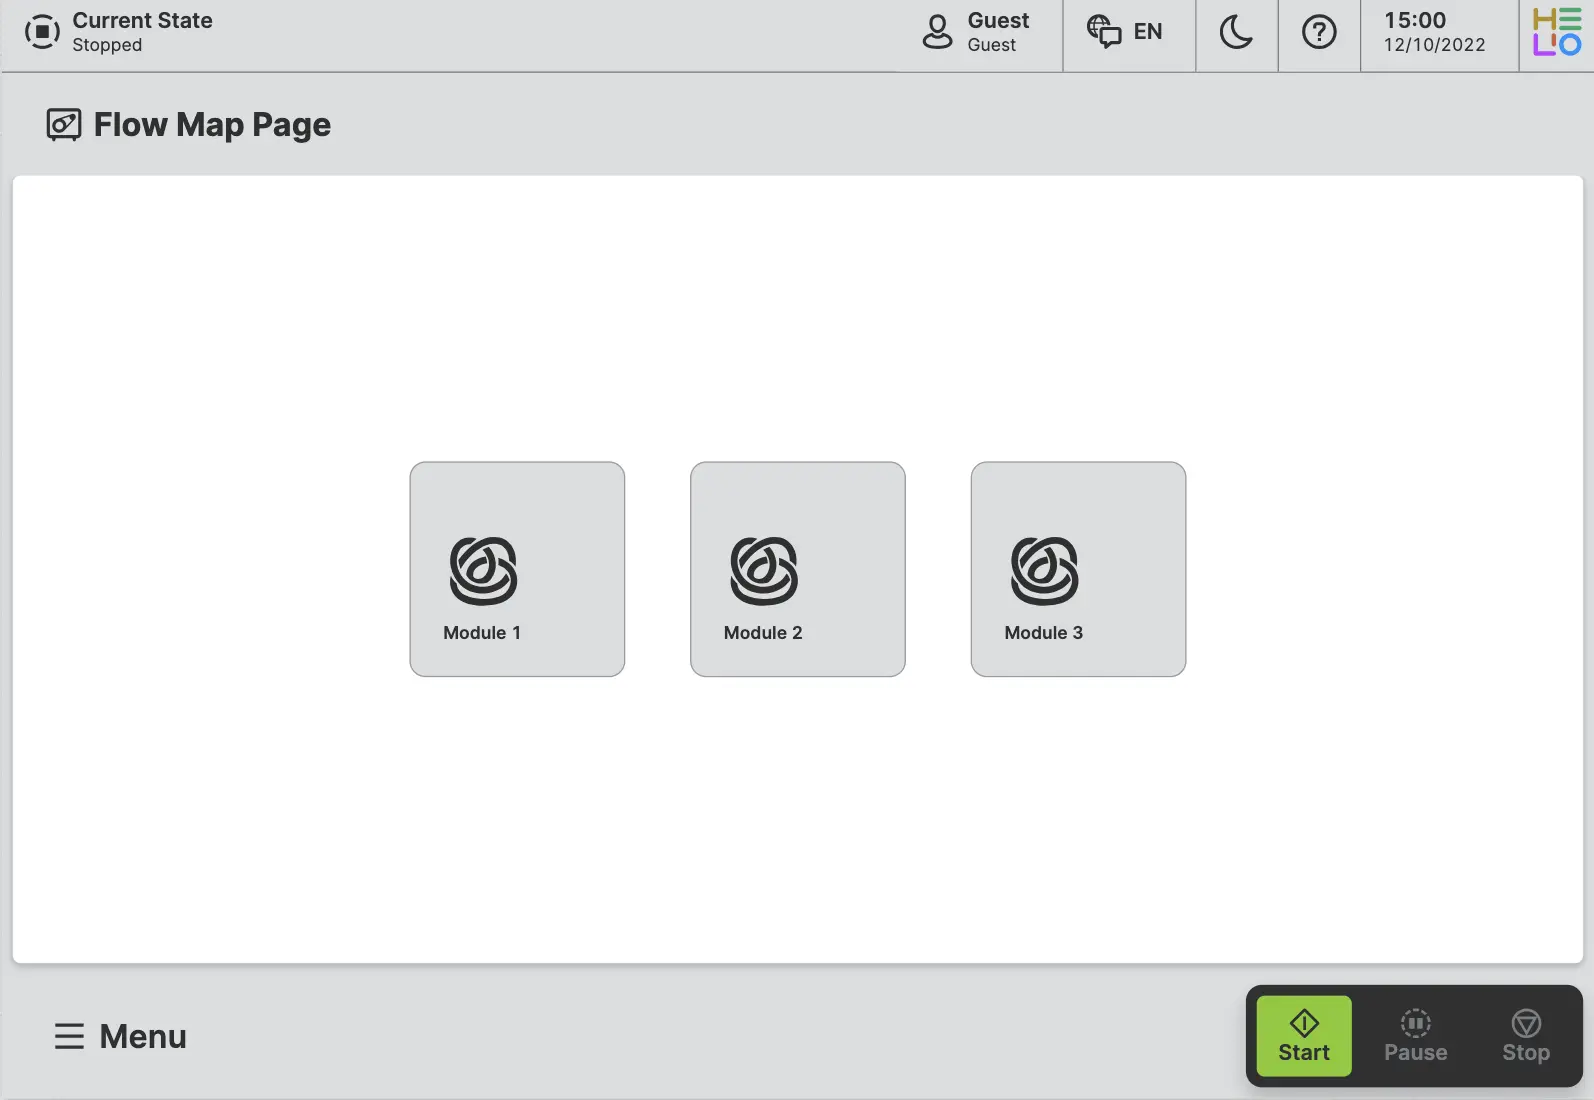
Flow Map Page
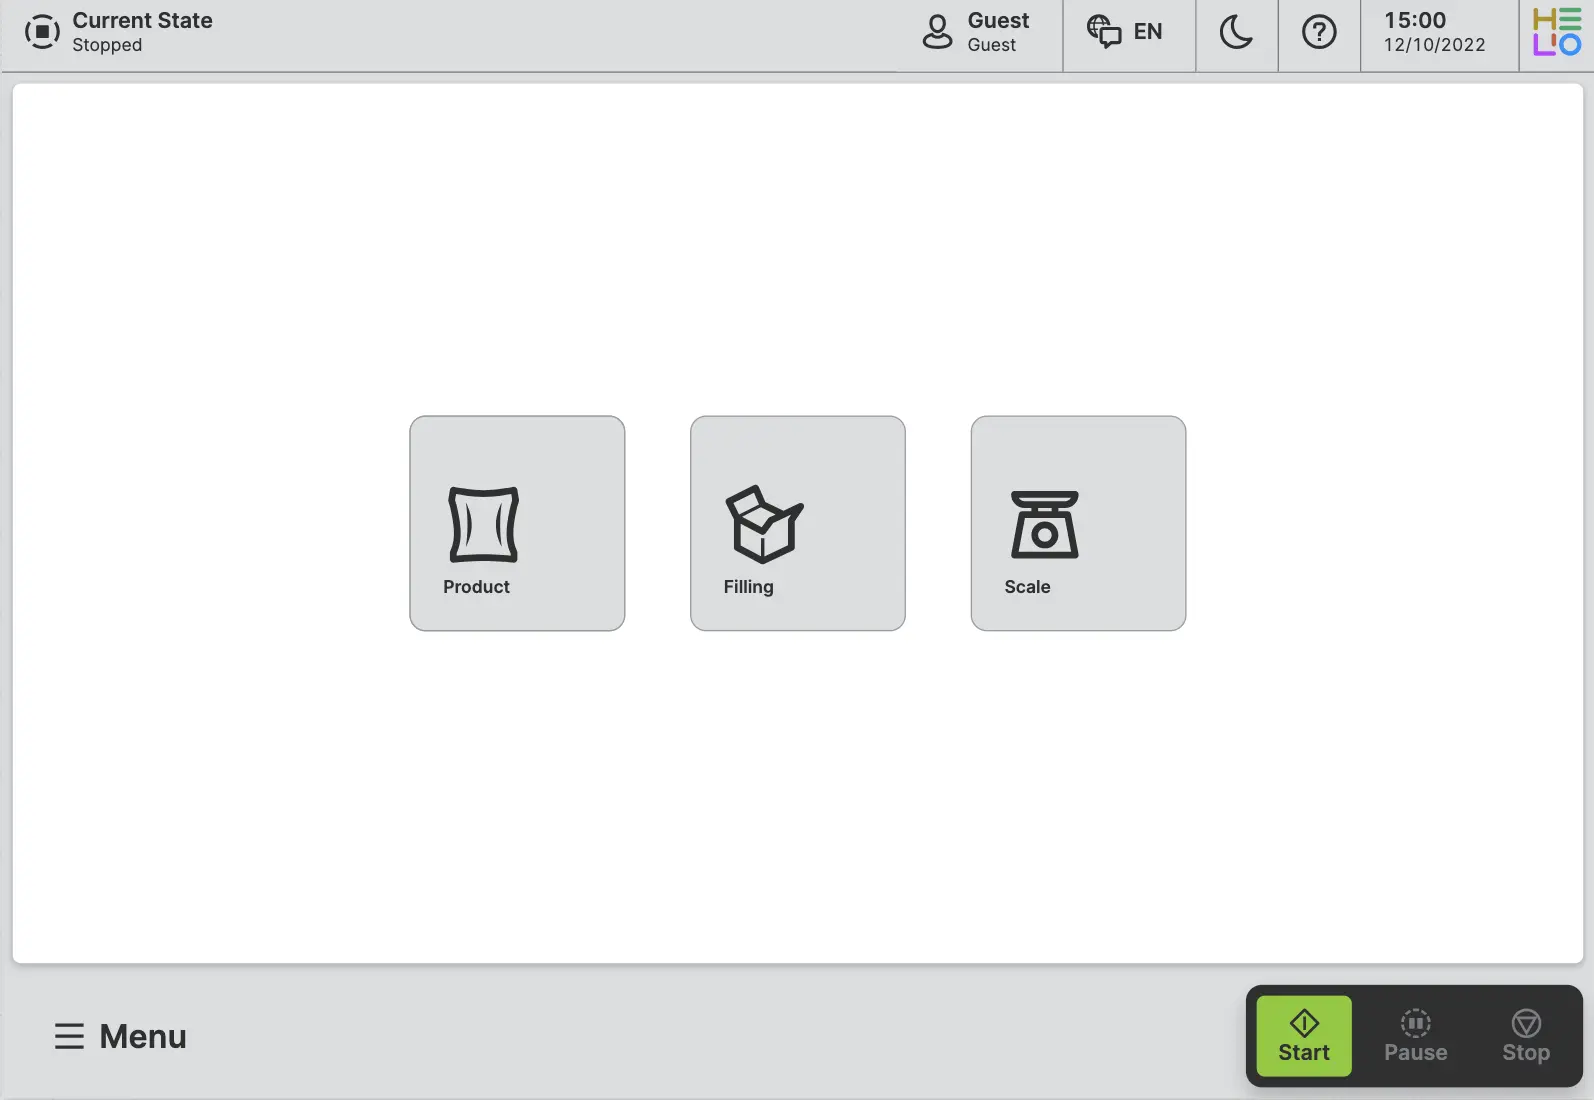
Switch to the Content View of the HELIO IDE and add a Flow Map Page to your HMI. HELIO will create a new page for you with three Flow Map Modules:
- Adjust Page Properties
For this guide we are going to hide the page header to create some more space, since we are working on a rather small HMI (1180x820px).
- In the
Page Section Conditionsof the page, set thePage headerproperty tofalse. - Also make sure that the
Module Sizeis set toMedium.
2. Optional: Setup Sample Data
You don't need real data to follow along. But if you'd like to make things feel more realistic, try connecting to the HELIO Playground PLC and import this data variable folder:
Objects > Examples
It will really help everything come together.
3. Modules – Define the Nodes of Your Flow
A Flow Map Module is a node in your workflow that can be connected to other modules using outlets. First, let's create all the nodes of our workflow.
- Add a Flow Map Module
Navigate to your Flow Map Page within the
HMI Content Tree and click the
+ button. Now simply add a Flow Map Module.
- Set up Module Properties
- Position Flow Map Module
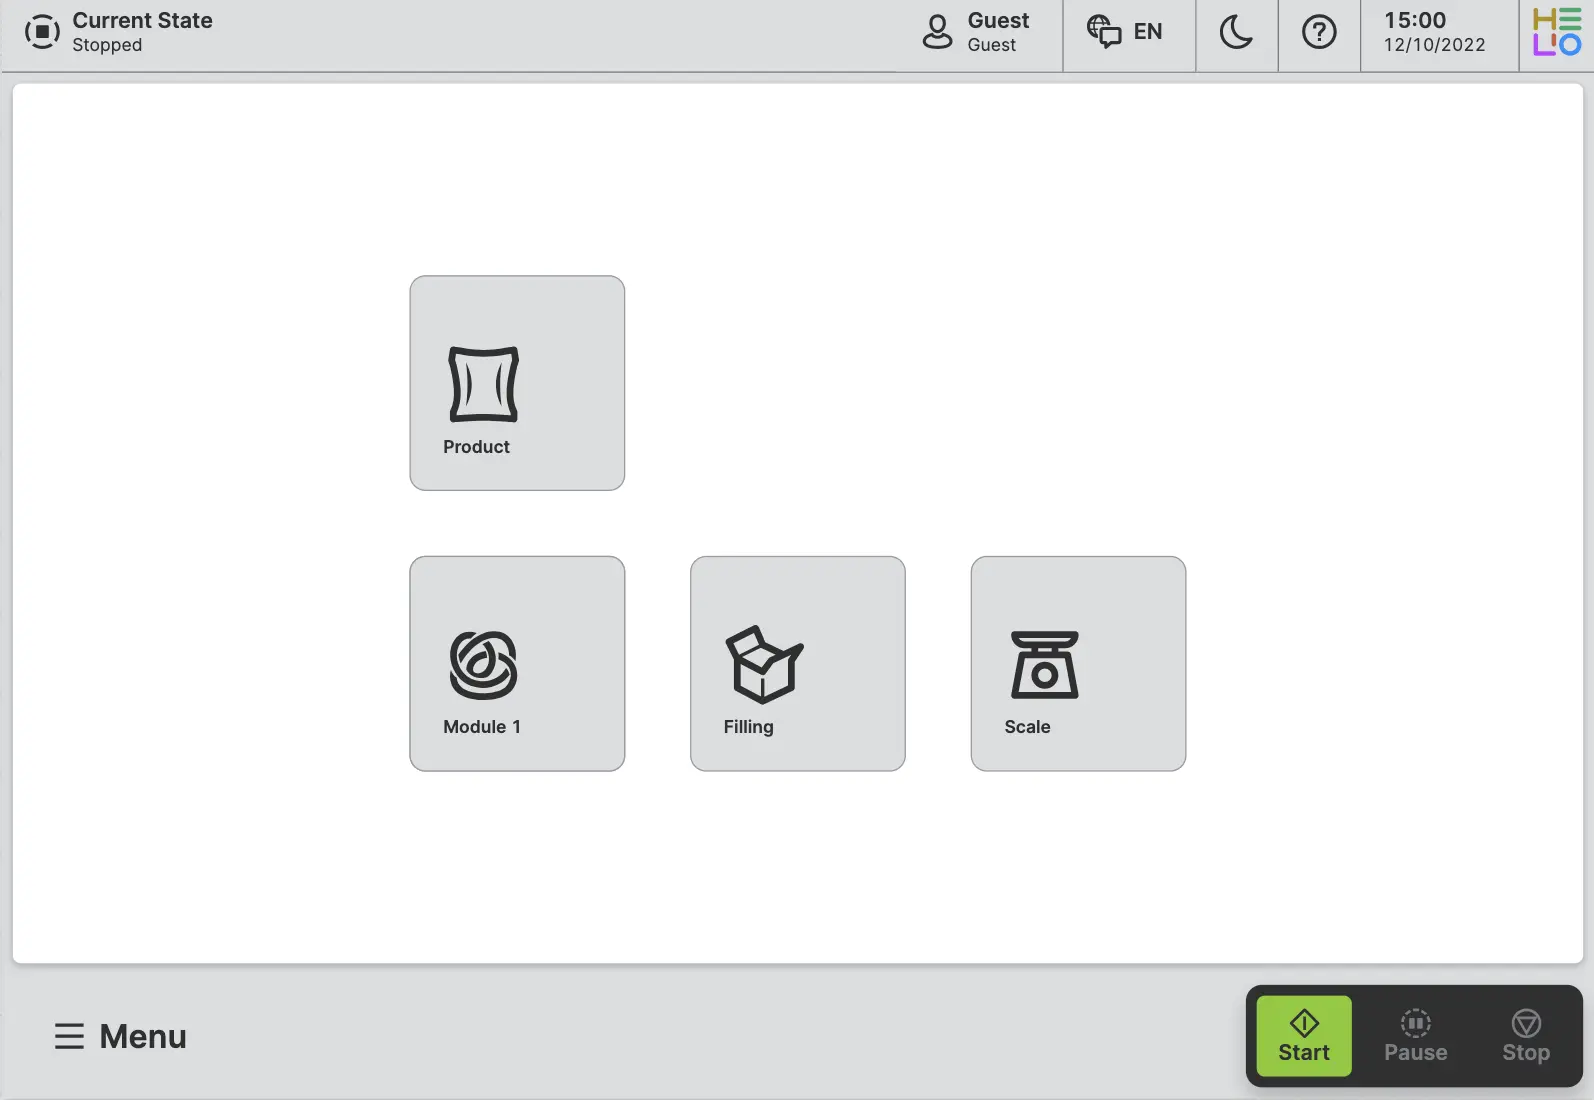
Now, if you've followed the first two steps you should have four modules on your page but should only be able to see three of them since two of them are overlapping.
This isn't a problem, but of course, we want to be able to see and position all our modules however we need.
- Navigate to the properties of the module you want to move, i.e.
the
Productmodule and find thePositionproperty group. - Now simply use the arrow buttons to move the module around.
Our
Productmodule really only needs to move one slot upwards. - Doing so should reveal the
Module 1underneath it, which we want to rename toScaleas well and set an icon for it.

- Repeat

4. Outlets – Establish Connections Between Modules
We're ready to link our modules together to get that "Flow" we need for the Flow Map Page.
Links are created using so called Outlets. Let's find out how this is done…
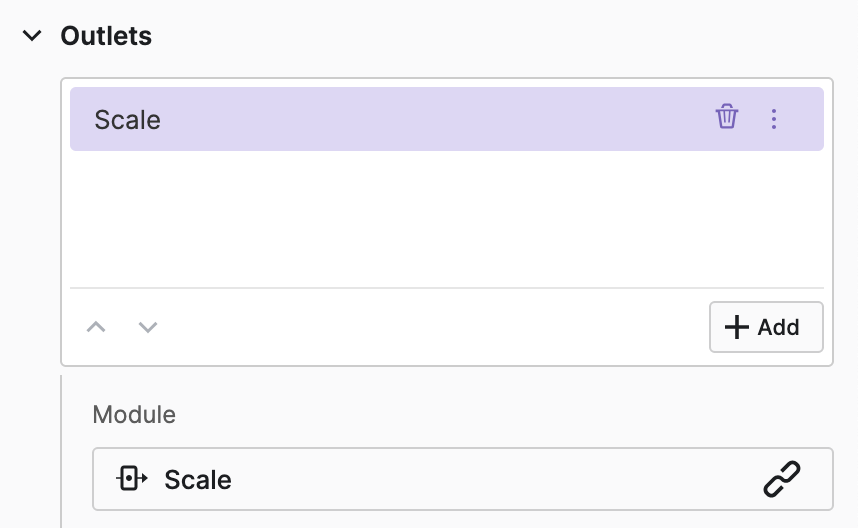
- Set Outlets

- Repeat
- Visualize Rejections
5. Connect Data to Visualize Status
Now, our page displays all the parts of our machine and the flow direction within. However, there is still something missing. Let's bring our flow map to life by adding data and statuses.
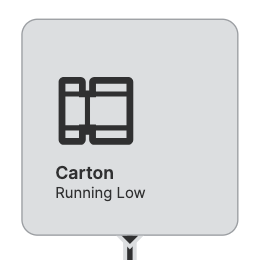
- Use Descriptions to Display Additional Information
For this step, let's use the "Carton" module as an example. Let's also assume that our machine is running low on cartons for packaging our product.
- Check the
Descriptionproperty of theCartonmodule. - Choose
Static Valueas its type. - Enter
Running Lowas the value for this description.
In a real-world scenario, you would want to set this description to the Data Variable (Dynamic Property) representing the number of cartons in the intake, or use an If Condition to display the description only when the cartons are running low.
For this guide, however, we're just going to keep it simple and use static values.
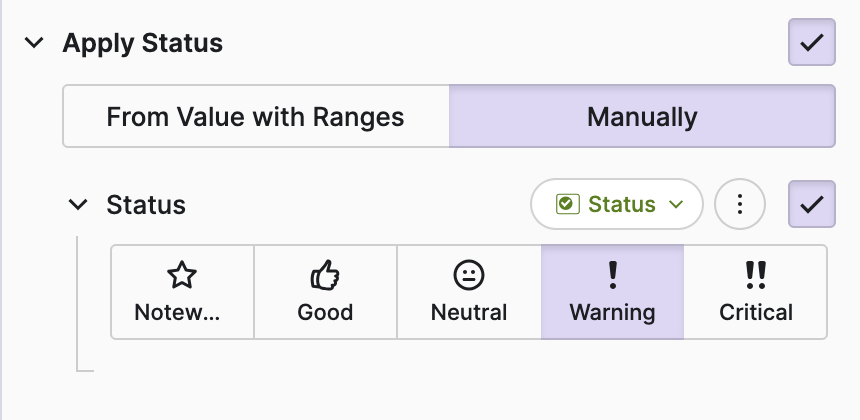
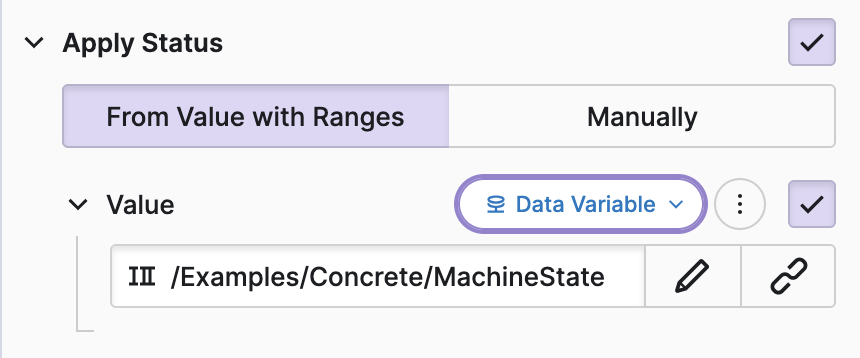
- Adjust the Module Status
Since our cartons are running low, we also want to make this module stand out a bit more than the others.
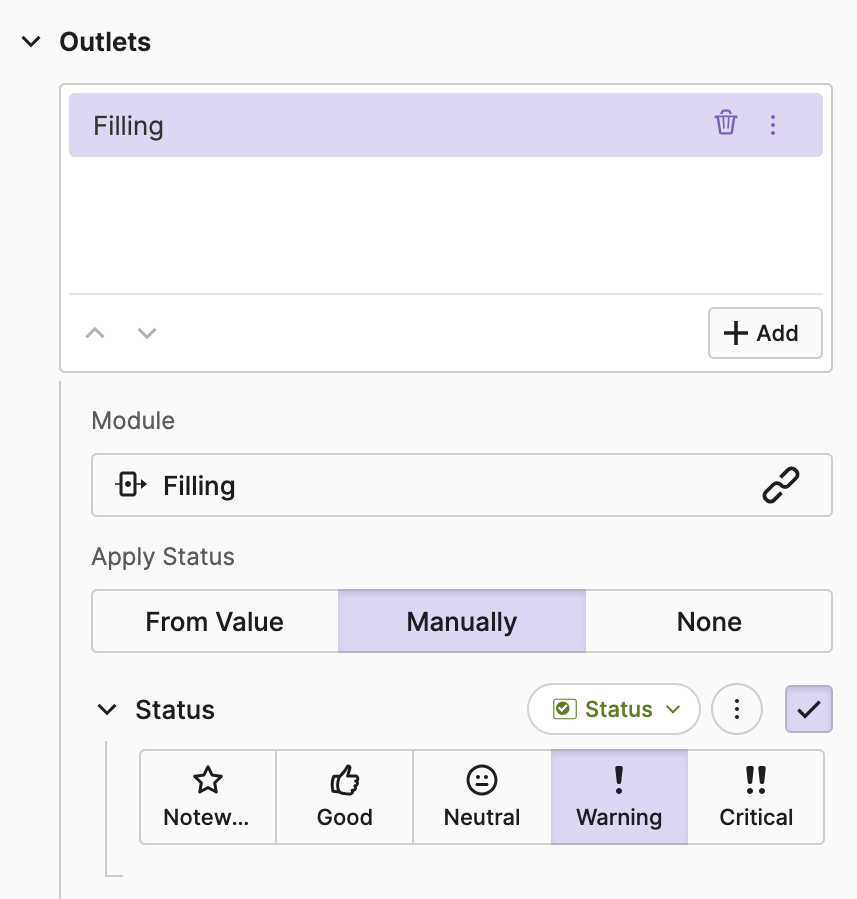
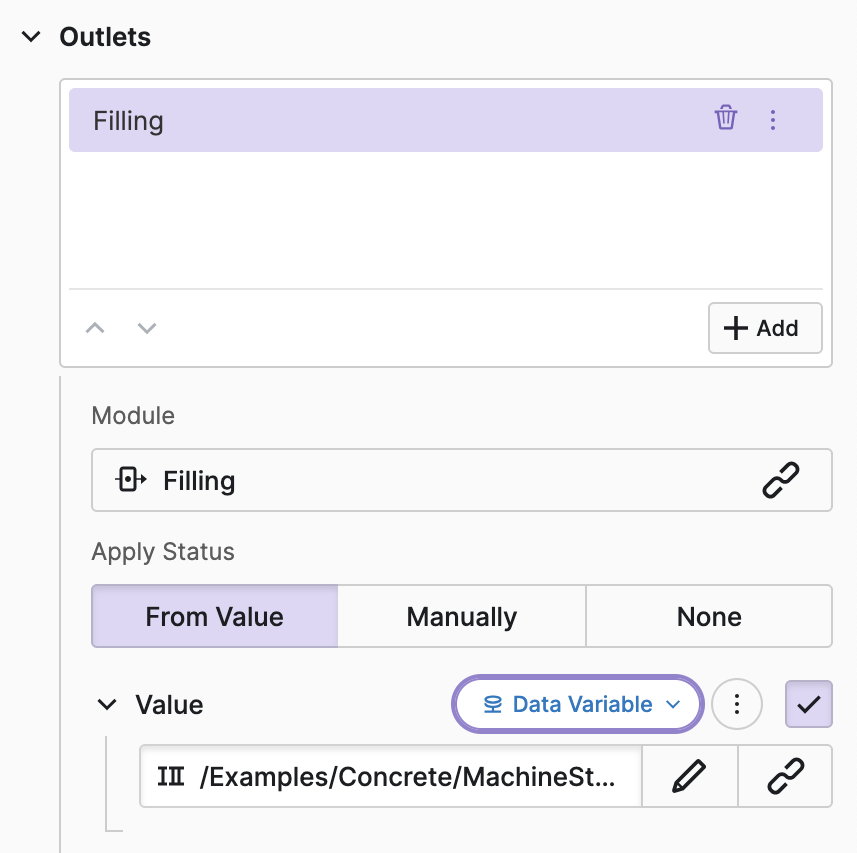
- Adjust Outlet Status
Since the low amount of cartons does impact our packaging module,
let's also update the status of the outlet. Navigate to the Outlets
property group of the module and…
- Activate the Outlet
Another common task within workflows is indicating that a step or outlet is running or active. In this example, production is still running, and there are cartons left. Therefore, let's set the outlet to active.
Set the Is Active property of the outlet to true.
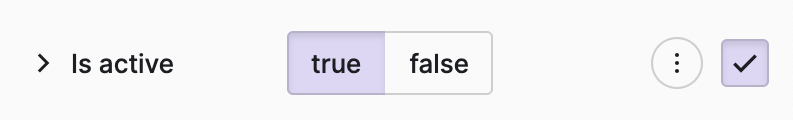
If you have followed all those steps, your module should now look something like this:
- Repeat
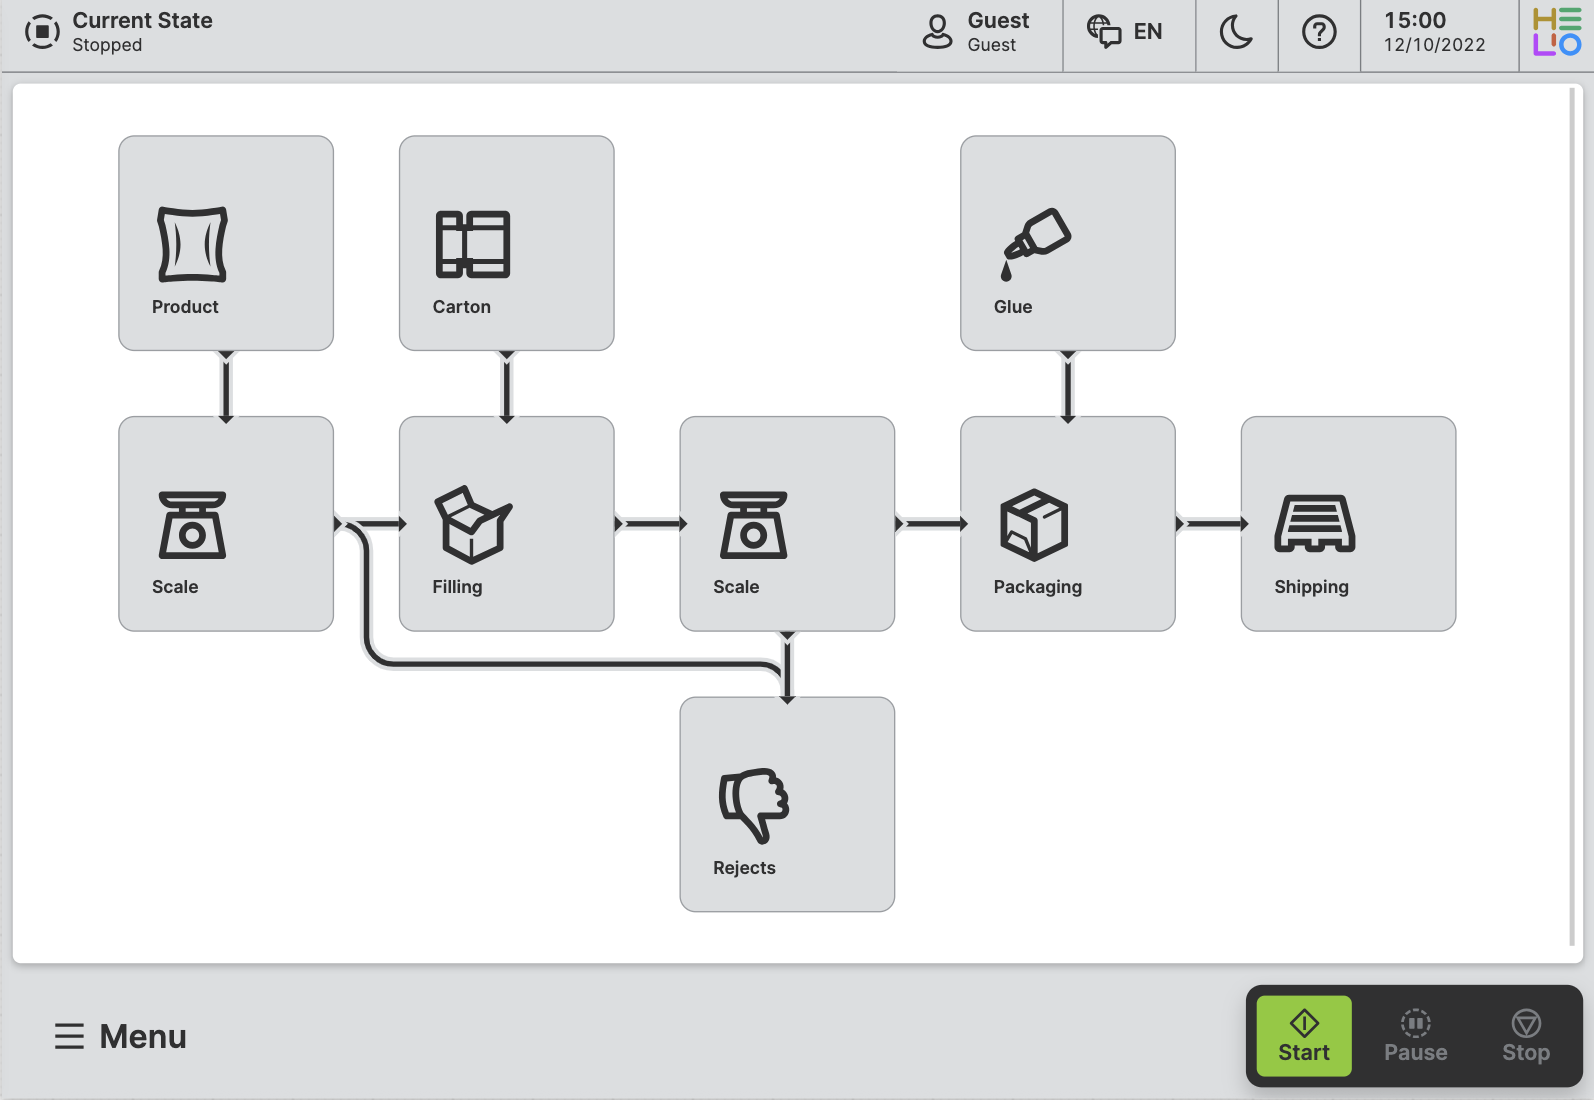
Goal: Make Your Flow Look Like This
Go through all the modules you've set up and set statuses and configure outlets until your page looks like the image below.
Bonus: Did you notice that the Glue module is blinking? That’s our
way of signaling that the machine needs immediate attention to get back
up and running. Take a look at the module's properties, you can
probably guess how you can pull this off!
6. Add Overlays for Details & Control
We won't go into a lot of detail, in order to keep this guide concise. But here are some ideas to think about:
Each Flow Map Module can have it's own
On Click action that you can use
however you like.
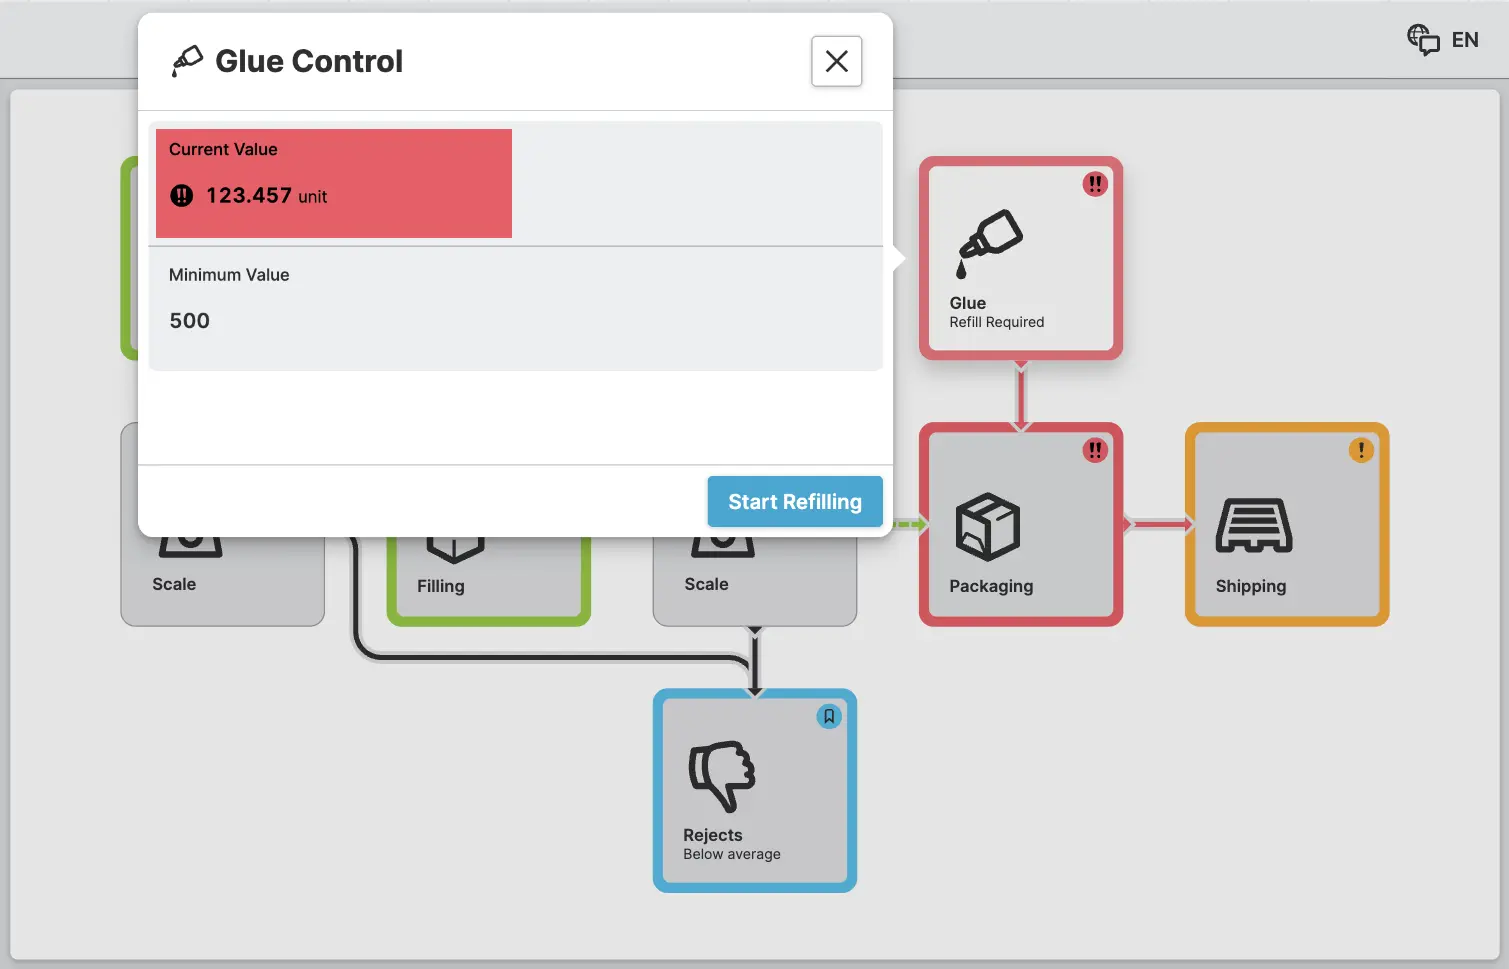
In this example, we display a control overlay for the Glue module that provides
more context about its state and allows you to execute actions.
We simply added a Open Page as Overlay Action to the module and linked that to a Parameter Page with some status information and a footer action.
Now, get out there and create even more sophisticated flow maps! We can't wait to see what you come up with!